It is not fuel efficiency; it is the engine efficiency, as you would get it if it was not installed in a car.
Most petrol engines in regular cars have a similar chart, because that is the most efficient for an average use, and what allows cars to pass emission tests.
Sports car may have better VE at higher RPM, which means they have less efficiency at lower RPM and lower load.
Race engines for track cars do not need to comply with strict road regulations, and usually have their best VE way higher in the RPM range.
VE is the efficiency of the engine; it lets you know how much torque it can produce, and the conditions for it. It is useful for the manufacturer, to install a gearbox that matches it; but it is pretty much useless to the end consumer.
Your question is actually 2 questions, depending on wether you want to optimize MPG or performance; but in both cases, this chart is not needed, mainly because torque at the engine is not the only thing that impacts MPG and performance.
To optimize MPG, the gearbox plays a very important role. As you noticed, VE is higher when load, not throttle position, is higher, but most driving is made cruising, which means low load. You could increase the load using the throttle, but it will only be temporary and it uses fuel. Increase the load by upshifting as soon as the car will take it -do not let it hiccup- and feather the throttle. This is true for every car. A car will get its best MPG on the tallest gear, at the lowest speed it can run it.
To optimize performance, the important data needed is power, and power = torque x rpm. Manufacturers always give the maximum power and the RPM it is produced.Except on diesel engines, max power is often way higher than peak VE, since rpm increase compensates for VE losses until VE really falls.
Hence to get the most performance off the engine, bury the throttle and upshift at the rpm max power is produced.
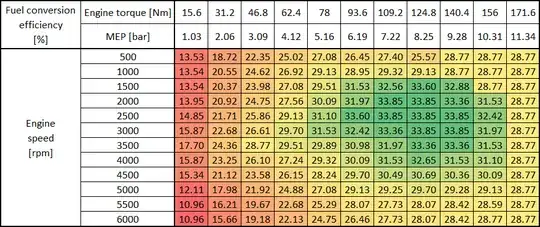
A final point: MEP and throttle are different. Think of MEP as the engine load, not throttle position, for a couple of reasons:
- the relation between throttle opening angle and air mass going through is not linear. The first degrees let a lot of air in. At 50% opening position,there usually is already 80% of the max airflow passing through.Modern cars with an electric pedal dont have a linear relation between the pedal position and the throttle position too...
- on a forced induction engine, you can have different air mass for the same throttle position